15.1. Available Reports
Motadata comes along with a set of pre-defined reports. The default Motadata server comes with the pre-defined reports and available in the Reports section.
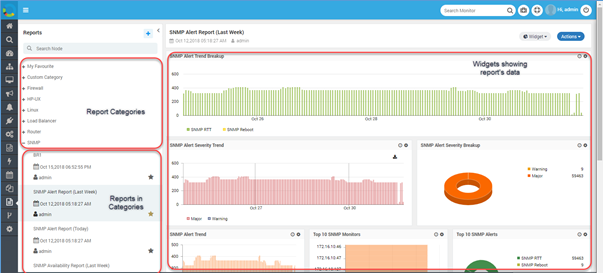
From the list of reports, select a report relevant to your monitors. The report will show the data in different widgets. You can edit a widget and change the filters/data to show different information. You may find some blank reports also. This happens due to many reasons but mainly because there is no monitor available for that report.
Report example: Once you have installed SNMP HSB and SU plugins in Motadata Apps then the pre-defined reports will show up along with predefined widgets.
Available Reports Structure
15.1.1. Default Report Categories
The default report categories are:
Firewall
HP-UX
Linux
Load Balancer
Router
SNMP
Switch
UPS
Windows
Windows AD
15.1.2. Customize Reports
Customizing the report is useful when you have almost all the required information and you just need to tweak few things to get the desired result. Default report gives you a head-start and you don’t need to create a report from scratch. All the reports (default and custom) supports following options:
Include/exclude the widgets in the data. Delete the widgets that you don’t require or create new widgets.
Create a new widget from scratch or by cloning another widget. You can use the existing widget and clone it into a new widget. The cloned widget uses different color schemes so you can easily identify the original and cloned widget.
Change the widget settings to change look-n-feel and the data. Edit the widget and explore the options available.
Change how widgets are displayed in the report. You can change the position of widgets (by drag and drop) and zoom in/out them for better readability.
Create a scheduler to send the report to all stakeholders at regular intervals.
Note: See Widgets for complete information about them.